For my first blog post I decided to write something on the IsDebuggerPresent function.If you were ever in the middle of debugging a program and it stopped all of a sudden, it probably had something to do with this function.
I will go through it in a very basic reverse engineering session and show how to change its outcome.
Sometimes when debugging a program, it will automatically terminate itself and you suddenly see “Process Terminated” in the bottom right.This is almost always a result from a call to IsDebuggerPresent. The program will call this function to see if a debugger is attached and then choose to terminate itself.This is a way for software companies to discourage you from debugging their code, but as we will see, it is very easy to circumvent.
Let's look at an example using Ollydbg and iTunes.
When we load iTunes in Ollydbg and press CTRL + N we see a list of all the Imports and Exports for the program. In this list we find the function IsDebuggerPresent located in kernel32.dll.
If now we press ENTER we will see a list of all references to this function.
Here you can set breakpoint on the different addresses and when you press ENTER again you will be taken to the actual function call.
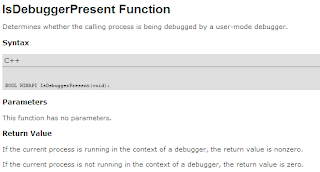
MSDN (http://msdn.microsoft.com/en-us/library/ms680345(VS.85).aspx ) teaches us that we should change the return value to zero if we want our debugging to go unnoticed. As this function returns a BOOL representing whether the process is being actively debugged. Now this approach would be a lot of work. Every time the function gets called we would have to change the value of EAX to 0 and then resume execution of the program. You could script it to return zero, but that’s unnecessary.
So let's take a closer look at how the function works.
First let's take al ook at the MSDN function definition:
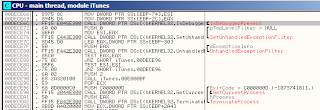
When we go back to Ollydbg and press enter on one of the calls we get taken to the functions assembly code, and we can see it only consists of 4 instructions.
The first line stores a pointer to fs:[18] in eax.
FS is a memory segment that holds information about the local thread ( for more info: http://en.wikipedia.org/wiki/Win32_Thread_Information_Block).
The second line stores the value at eax, +30 back into eax.
So let's see what that is. In the bottom left corner of Ollydbg we have the dump window. When we press CTRL + G we can enter an expression. We enter: eax + 30 and press ENTER.
This takes us to 7ffdf030, which is 7ffdf000 + 30.
At this address we see the value 0050fd7f, which is stored in little endian. This means the bytes are stored in reverse order, so the address stord is 7ffd5000.
If we press CTRL + G again and put [] brackets around our expression, making it [eax+30], we see that we get taken to this address.
When we step through the code live in Ollydbg, we see that this is exactly the address that is stored into EAX.
The third instruction is a MOVZX instruction. This is the same as a MOV but it extends the zero's in the destination register.
So in our case it will copy the value at EAX + 2 into eax and extend the zero's. This means that the entire contents of the register is the byte value read into the least significant byte of the register, the excess 24-bits are initialized to zero. Notice that this instruction uses a BYTE PTR.
We can see in the dump window that the value at EAX + 2 is 0x01, so this line of assembly language will store 0x00000001 into EAX. Translate this to a BOOL value and we see that it returns TRUE.
The last line of our function is a simple RET, which will resume execution to the caller of the function. Allowing them to determine whether the process is being debugged.
Also, when we enter fs:[30] as an expression in the dump window, we also get taken to 7ffdd000.
Fs:[30] is a pointer to the Process Environment Block (PEB), which the kernel populates to contain information relating to the environment and state of the process, including the BeingDebugged flag.
This means that the first two lines of the function can be rewritten as:
mov eax, dword ptr fs:[30]
So, to disable the IsDebuggerPresent function, all we have to do is go to the dump window, press CTRL+G and enter fs:[30]. Then we just select the 3rd byte, which will be 01 and change it to 00. (Just start typing and Ollydbg will change it).
Now we can continue to debug our target program without it ever knowing...


